As a Linux system administrator, troubleshooting process-related issues can be a daunting task. With the increasing complexity of modern systems, it’s essential to have the right tools in your arsenal to diagnose and resolve problems efficiently. The strace command, a powerful debugging tool, is one such tool that can help you gain insight into the inner workings of your system processes. In this article, we’ll explore the top 10 essential strace commands for Linux process troubleshooting, empowering you to tackle even the most stubborn issues with confidence.
Table of Contents
- What is Strace command?
- 10 Essential Strace Command for Linux Process Troubleshooting
- 1. Trace Running Processes Effortlessly with strace command strace -p
- 2. Exploring Process Tracing with strace command strace -f in Linux
- 3. Analyzing System Call Performance with strace -c in Linux
- 4. Diagnose Performance Issues Using strace -t command
- 5. Using strace -s command to Display String Arguments
- 6. Redirecting Output with strace -o command: Streamlining Trace Analysis
- 7. Efficient Debugging with strace -e: How to Filter System Calls
- 8. Summarizing Call Frequency and Duration with strace -S Command
- 9. Detailed Output with strace -v: Verbose Tracing for In-Depth Analysis
- 10. Clean Up Debug Output with strace -q: A Guide to Quiet Mode
What is Strace command?
Strace command (System Trace) is a command-line utility that allows you to monitor and debug system processes by tracing system calls and signals. It provides a detailed view of the interactions between a process and the operating system, enabling you to identify performance bottlenecks, resource leaks, and other issues.
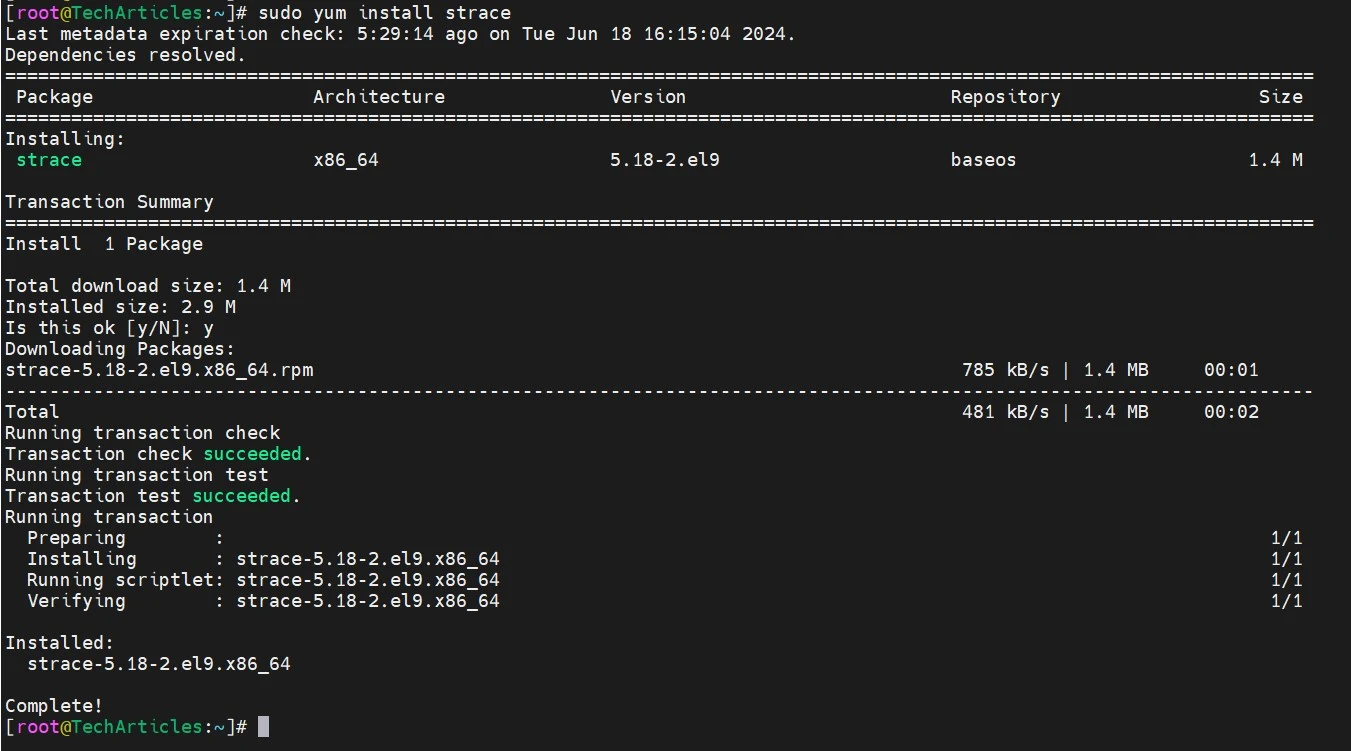
How to install strace command in CentOS or Redhat Linux
$ sudo yum install strace
Installing strace command in ubuntu linux
$ sudo apt-get install strace
Reading package lists... Done
Building dependency tree... Done
Reading state information... Done
The following NEW packages will be installed:
  strace
0 upgraded, 1 newly installed, 0 to remove and 272 not upgraded.
Need to get 567 kB of archives.
10 Essential Strace Command for Linux Process Troubleshooting
1. Trace Running Processes Effortlessly with strace command strace -p
The -p option in strace command in Linux is a powerful tool for monitoring and debugging running processes with the specified process ID (PID). Use this command to monitor a existing process in real-time, gaining insight into its system calls and interactions.
strace -p <PID>
Example: If you want to trace a process with a PID of 999, you would run:
strace -p 999
Use Cases of strace -p command
- Debugging: Identify why a process is hanging or crashing by examining the system calls it is making.
- Performance Analysis: Determine which system calls are taking the most time and optimize accordingly.
- Resource Monitoring: Check for excessive file or network operations that may indicate a problem.
2. Exploring Process Tracing with strace command strace -f in Linux
The -f option in strace command in Linux is a powerful tool that allows you to trace system calls and signals made by a process and its child processes. This feature is particularly useful for debugging complex applications that spawn multiple processes, as it provides a comprehensive view of how these processes interact with the system.
strace -f ./your_program
Example: If you want to trace a program called my_app, you would run:
strace -f ./my_app
Use Cases of strace -f command
- Debugging Multi-Process Applications:
strace -fis ideal for applications that create child processes, allowing you to see the complete picture of system interactions. - Performance Analysis: Identify bottlenecks in both parent and child processes by examining their system calls.
- Resource Monitoring: Track file and network operations across multiple processes to diagnose potential issues.
3. Analyzing System Call Performance with strace -c in Linux
The -c option in strace command in Linux is a powerful tool for summarizing the performance of system calls, , CPU usage, and memory allocation made by a program. This option provides a concise overview of how many times each system call was invoked, the total time spent in each call, and the average time per call, making it an invaluable resource for performance analysis and optimization.
strace -c <command> or <your_application>
Example: If you want to analyze a program called my_app, or any command you would run:
strace -c ls
strace -c ./my_app
Use Cases of strace -c command
- Performance Tuning: Identify which system calls are consuming the most time and optimize your code accordingly.
- Debugging: Understand the behavior of your application by analyzing the frequency and duration of system calls.
- Resource Management: Monitor how your application interacts with system resources, helping you to make informed decisions about resource allocation.
4. Diagnose Performance Issues Using strace -t command
The -t option is strace command in Linux is a useful tool for tracing system calls made by a program while also displaying the time each call was made. This can help you understand the timing of operations and diagnose performance issues in real-time.
For example, you can trace the ls command:
strace -t ls
Understanding the Output: The output will show each system call made by the ls command, prefixed with a timestamp indicating when the call was made. The format will look something like this:
00:00:00.000000 execve("/bin/ls", ["ls"], 0x7fffdc1c3c40) = 0
00:00:00.000000 brk(NULL) = 0x55f3c1e1e000
00:00:00.000000 access("/etc/ld.so.preload", R_OK) = -1 ENOENT (No such file or directory)
Use Cases of strace -t command
- Performance Analysis: By examining the timestamps, you can identify delays in specific system calls and optimize your application accordingly.
- Debugging: Understand the sequence and timing of system calls to diagnose issues in command execution.
- Monitoring: Track how long certain operations take, which can be useful for system administration and performance tuning.
5. Using strace -s command to Display String Arguments
The -s option in strace command in Linux allows you to specify the maximum string size to be printed for string arguments in system calls. This is particularly useful when you want to see the full content of strings passed to system calls, such as file paths or data being sent over a network.
Example: To see the string arguments used by the echo command, you can run:
strace -s 100 echo "Hello, World!"
Output: The output will include the system calls made by the echo command, and you will see the full string “Hello, World!” printed in the trace:
execve("/bin/echo", ["echo", "Hello, World!"], 0x7fffdc1c3c40) = 0
brk(NULL)                               = 0x55f3c1e1e000
...
write(1, "Hello, World!\n", 13)         = 13
Use Cases for strace -s command
- Debugging String Arguments: Capture exact string arguments in system calls to identify issues with file paths or command-line inputs.
- Network Data Inspection: Inspect full data being sent or received in networked applications to troubleshoot communication problems.
- File Operation Verification: Monitor file access to ensure the correct files are being read or written by the application.
- Security Auditing: Check for sensitive data in system calls to prevent insecure logging or transmission of confidential information.
- Configuration Validation: Verify that the correct configuration files and settings are being used by the application.
6. Redirecting Output with strace -o command: Streamlining Trace Analysis
The -o option in strace command allows you to redirect the output of the trace to a specified file instead of displaying it on the terminal. This is particularly useful for analyzing the trace data later, especially when dealing with a large volume of output. By saving the output to a file, you can easily search, filter, and review the system calls made by a program without losing any information.
strace -o <output_file> <command>
Example: To trace the ls command and save the output to a file named trace_output.txt, you can use the following command:
strace -o trace_output.txt ls -l /path/to/directory/file
Use Cases of strace -o command
- Post-Mortem Analysis: Analyze trace data after an application runs to identify issues without real-time clutter.
- Long-Running Processes: Capture output in a file to prevent terminal overflow during extended application execution.
- Collaboration and Reporting: Easily share trace findings with team members or include them in reports for collaborative debugging.
- Automated Analysis: Use scripts to parse and analyze trace data, enabling automated monitoring of system call behavior.
- Performance Benchmarking: Identify bottlenecks and optimize performance by analyzing system calls captured in the trace output.
Also Read | SAR command in Linux to monitor system performance
7. Efficient Debugging with strace -e: How to Filter System Calls
The -e option in strace command allows you to filter the system calls that you want to trace, making it easier to focus on specific operations of interest. This targeted approach can significantly reduce the amount of output generated, helping you to quickly identify relevant information without sifting through unnecessary data.
strace -e <system_call> <command>
Example: with ls commanf
strace -e open ls -l
In this example, strace will trace only the open system calls made by the ls -l command, filtering out all others. This is helpful when you want to examine how a specific system call interacts with the process, saving time and simplifying output.
Use Cases of strace -e command
- Focused Debugging: Narrow down the trace to specific system calls relevant to the issue at hand, making it easier to diagnose problems.
- Performance Tuning: Analyze only the system calls that impact performance, such as network or file operations, to identify bottlenecks.
- Security Auditing: Monitor specific system calls related to security, such as
execveoropen, to detect potentially malicious behavior. - Learning and Exploration: Use targeted tracing to understand how specific system calls work within an application without overwhelming output.
- Testing and Validation: Validate that an application is making the expected system calls during testing by filtering for those specific calls.
8. Summarizing Call Frequency and Duration with strace -S Command
The -S option in strace command enables you to summarize system call statistics, providing insights into the frequency and duration of each system call made by a program. This feature is particularly useful for performance analysis, allowing you to identify which system calls are most frequently invoked and how much time is spent on each.
strace -c -S <sort_option> <command>
Example: with ls command
strace -c -S time ls -l
In this example, strace will run ls -l, and then display a summary sorted by time spent on each system call. You can replace time with options like calls or errors to adjust the sorting criteria.
Use Cases of strace -c -S command
- Performance Analysis: Quickly identify which system calls are consuming the most time, helping to pinpoint performance bottlenecks.
- Optimization: Focus on optimizing frequently called system calls to improve overall application performance.
- Resource Usage Monitoring: Understand how system calls impact resource usage, aiding in capacity planning and resource allocation.
- Comparative Analysis: Compare system call statistics between different versions of an application to assess performance improvements or regressions.
- Debugging: Use the summary to identify unexpected system call behavior that may indicate bugs or inefficiencies in the code.
9. Detailed Output with strace -v: Verbose Tracing for In-Depth Analysis
The -v option in strace command enables verbose output, providing additional details about system calls and their arguments. This option is particularly useful for gaining deeper insights into the behavior of a program, as it reveals more context about the data being passed to and from system calls.
strace -v <command>
Example with ls
strace -v ls -l
In this example, strace will run ls -l and display more detailed information about each system call, including complete arguments and full output. This level of detail is especially useful for deep debugging and understanding complex interactions in system calls.
Use Cases of strace -v command
- In-Depth Debugging: Gain a comprehensive understanding of how a program interacts with the operating system by examining the arguments and return values of system calls.
- Data Inspection: Inspect the data being passed to system calls, such as file paths or buffer contents, to identify issues related to incorrect parameters or unexpected values.
- Learning Tool: Use verbose output as an educational resource to learn about system calls and their usage in real-world applications.
- Complex Applications: Analyze complex applications where understanding the flow of data through system calls is crucial for troubleshooting.
- Configuration Issues: Identify misconfigurations or incorrect assumptions in code by examining the detailed output of system calls related to file access or network communication.
10. Clean Up Debug Output with strace -q: A Guide to Quiet Mode
The -q option in strace command enables quiet mode, which suppresses the output of certain messages that are typically printed to the standard error stream. This option is useful when you want to focus on the essential system call information without being distracted by extraneous messages, such as those related to process forks or other non-essential notifications.
strace -q <command>
Example with ls
strace -q ls -l
In this example, strace -q suppresses all output except the essential system call summary, making it useful for quickly collecting data without clutter. It’s ideal when you want minimal feedback during tracing.
Use Cases of strace -q command
- Cleaner Output: Focus on the relevant system calls without the clutter of additional messages, making it easier to analyze the output.
- Log Analysis: When redirecting output to a file for later analysis, using quiet mode can help ensure that only the necessary information is captured.
- Scripting and Automation: In automated scripts where you want to capture system call data without additional noise, quiet mode can streamline the output.
- Performance Monitoring: When monitoring performance, reducing output noise can help you quickly identify the system calls that are relevant to your analysis.
- Debugging Simplicity: Simplify debugging sessions by filtering out non-essential messages, allowing you to concentrate on the system calls that matter most.
Also Read | Top 15 netstat Commands in Linux with Examples for System Administrators
Conclusion
Strace command is a powerful tool that can help you troubleshoot even the most complex process-related issues on Linux systems. By mastering these 10 essential Strace commands, you’ll be well-equipped to diagnose and resolve problems efficiently, ensuring your systems run smoothly and efficiently. Whether you’re a seasoned administrator or a newcomer to Linux, Strace is an invaluable tool that deserves a place in your troubleshooting toolkit.
Reference: For detailed information about the strace command, including its options, usage, and examples, you can refer to the official Linux manual page available at the following link: strace(1) – Linux manual page.